Wednesday, April 25, 2012

!Useful Matlab Tips!

Matlab feature: varargin

Matlab documentation for the feature: http://www.mathworks.com/help/techdoc/ref/varargin.html

Description: This allows you to specify a variable amount of arguments as input.

How this helped me:  

A major part of our development process was working on parts of the pipeline as scripts to get functionality to work. In this phase, we set default values to load for many things.

After we got basic functionality, this became a slight problem as we had to turn the scripts into functions to piece together all the code.

By specifying variable number of arguments, we were able to keep the script functionality for quick testing while still having the ability to piece things together.

The most useful place this happened was in getDataMat.m
This function takes one of our dataset images, reads in each cell that contains a symbol, and outputs a matrix with of the data and the corresponding class descriptions.

getDataMat turns each of these symbols into a matrix

By using varargin, I was able to make it have 3 modes of operation:

1) The original script functionality

2) Ability to specify a directory, then all the *.jpg images from the directory will be grabbed.
EX:[x y] = getDataMat('directory', ''images/logic');

3) Ability to specify a variable number of file paths to read in:
EX: [x y] = getDataMat('images/logic/exist_1.jpg','images/logic/forAll_1.jpg');
[x y] = getDataMat('images/logic/forAll_1.jpg');

HOWTO use/Screenshots of relevant code: (I hope this doesn't contain bugs!!)

To use it, just include varargin as a parameter.
EX: function [data_x data_y] = getDataMat(varargin)

Then do:
    nVarargs = length(varargin);

and have an if statement that changes the functionality based on the number of arguments.

Note: varargin is a cell array, so you will have to index it like so: varargin{i}

This can cause some tricky type errors, so be careful!!

Example usage!


By using this feature, tedious coding to play with different subsets of the data was eliminated! I hope it helps you too!

Useful links to help use this feature:

http://blogs.mathworks.com/pick/2008/01/08/advanced-matlab-varargin-and-nargin-variable-inputs-to-a-function/
http://makarandtapaswi.wordpress.com/2009/07/15/varargin-matlab/

Monday, April 23, 2012

Prototype: Iteration 1


All major parts of the pipeline have been touched now, and given basic functionality.


For ease of implementation, we decided that working with a proper subset of 1st order logic would be a reasonable goal. This allows us to get a "working" prototype while side-stepping issues like superscripts/subscripts and bounding box problems. As we get this prototype to increase accuracy on first-order logic, we will look into ways to expanding it to deal with more complex mathematical structures.

The subset of first-order logic that we will be working with for now includes the following symbols:

16 symbols total

It is quite literally a *proper* subset, as it only includes the proper subset symbol! In this scheme equals is created using not and not-equals.


New Dataset:

To help with this goal we have started creating a second toy dataset, made out of 300 examples each of 16 symbols. The scripts that do preprocessing and turn these images into matrices has been turned into functions that automate a lot of what we were doing tediously by matlab commands before.

So far we have 5 symbols finished.

Extraction:

Oren wrote code that takes the bounding boxes from the segmenter and extracts the characters into individual images. We are trying to keep this code as independent of the segmenter as possible. The extractor works well, but it is given lots of garbage by the segmenter.  

The next iteration of this code will have to output positional information about the symbols as well, so that a graph structure can be created to help the parser.

Classification:


We have trained on the 5 symbols we have data for (forAll, exist, x, y, R,). Accuracy was greater than chance! However, only 2 classes were ever predicted (exist and x) so the 40% didn't seem very meaningful.

The next step with the classifier is the find new features, and to modify it so that it gives "soft" predictions of the top few most probable classes. This soft output will be helpful for the parser.


Parsing:

I wrote a simple substitution based linear parser in python using scipy/numpy. This was a task that was much easier doing in python than matlab. Creating complex graph structures and parsing them is not something I am looking forward to doing in matlab, but would be a joy in python, so I'm planning on using python for this process for the time being.

If we have time, the code may be ported to matlab (or the rest of the matlab code might be ported to python!!)!

Prototype Iteration 1 Demo:

To test the prototype the following formula was scanned:

This sentence is the definition of a function.

We ran it through the segmenter, which output 21 boxes given these 7 symbols. 

Of those, 6 were garbage from a smear on the paper. The rest were slight translations of the correct character extraction. 

We cheated and filtered out the garbage and repetitions for the sake of a first demo. The seven selected images were then run through the classifier. The classifiers output was then run through the parser, resulting in the following .tex file:

LaTeX generated by parser.

Which results in this after pdflatex:
Our systems prediction 

While the original samples true results should have been:

The correct classification/parsing


TODO:

  • Classification the most important now, we need to find features with greater discriminative power
  • We have decided to read at least one computer vision paper a week in order to get ideas and get a good feel for what we should make our final paper look like.
  • We need to start work on outputting the graph structure for the parser.

Looking ahead (perhaps too far), the following is a tentative list of how we will expand the scope of this project as the 1st order logic accuracy increases:

1) add numbers
2) add subscripts/superscripts
3) Discrete Math symbols
4) Calculus symbols
5) Linear Algebra (matrices)
6) ???????
7) Profit!!

I expect to get to at least 3, possibly 4. Once work begins on creating the graph structure for parsing, we can see how distant a goal linear algebra is. 


Wednesday, April 18, 2012

Pipeline + random updates

To help with planning the project I created a diagram of the planned pipeline for HERC using http://www.diagram.ly/. The most updated pipeline image can be found in the repo here.


As shown, the pre-processing, localization, and classification components have "Basic Functionality" implemented, though they have a long way to go until they have "Decent Functionality".

A current goal is the try to get all the components "Basic Functionality" implemented (even if they don't exactly "work") so we can do ceiling analysis. Ceiling analysis is where you see how much a part of the pipeline working 100% would increase overall performance of the system. To do this you iteratively hand feed correct results from each part to the rest of the parts and see how much the entire systems accuracy increases.

This is a method to help prioritize which parts of the pipeline to work on. More information can be found on the Stanford ml-class preview videos site in unit XVIII video "Ceiling Analysis: What Part of the Pipeline to Work on Next "

________________________________________________________________________


Classifier Improvement


Last post, we implemented cross validation and discovered that our classifier didn't perform better than chance. We were just using the raw pixels so this wasn't too surprising.

I found a file on the matlab fileexchange for HOG(Histogram of Oriented Gradients) features. Putting our toy dataset through it transformed a 1000x24963 matrix into a 1000x83 matrix.

This significantly increased the speed it takes to run from 8 minutes for one fold to 5 folds in 32 seconds.

The accuracy also went up, from 5.7 to 11.4! Which is *better* than chance. Confusion matrices have been generated for each fold and put in mistakes.mat in the repo, but we haven't interpreted them yet to figure out where to go from here.


The speed increase made it easier to explore the effect of different values of the lambda parameter for regularized logistic regression .


High values of lambda didn't help

Exploring closer to .1


The values  
[0 0.0900 0.1000 0.1100 0.1250 0.1500 0.2000 0.5000 0.7500 1.0000  
10.0000 20.0000] were tested.


The corresponding mean cross-validation accuracies were:

[10.5000   11.2000   11.4000   10.6000   11.2000   10.6000   10.3000    9.9000   10.3000 10.7000    9.6000    9.7000]


In the end .1, the value that lambda had originally been set to, worked best.

Accuracies for different values of lambda at each fold can be found here.


___________________________________________________________________________


Localization Update


We still haven't gotten around to figuring out how use some of the infty dataset. We need to parse some comma-separated values in .txt files to do this. Some of the dataset, however, was given in raw images. I passed these through the localizer to see how it performed. It does well (which is to be expected, as these aren't noisy handwritten images), but still has the same problems with non-connected parts.


 ____________________________________________________________________________


Misc


A few things accomplished since monday:

  • Cleaned up some code (vectorizing stuff,  replacing own implementation of a few things with matlab commands, added/deleted/fixed comments)
  • Started research on making synthetic data to expand toy dataset
  • Made folder of each toy dataset sample as an individual image, to help with feature extraction/testing


Sunday, April 15, 2012

Cross-Validation


When training a classifier, data is separated into a training set, and a testing set. The training set is used to learn about the aspects that differentiate items, and the testing set is used to evaluate the results. While it is tempting to use all the data to train the classifier, this can cause problems if the classifier merely memorizes the training set, and fails at classifying novel samples.

This effect is called overfitting.


In order to avoid overfitting, there is a technique called cross-validation. Cross-validation takes a dataset, breaks it into partitions, and uses them to separately train and test a classifier. By using the data to separately train and test in different combinations, it is easier to see how well a classifier performs.
(image from nltk)

Cross-Validation helps prevent fallacious reasoning when testing hypotheses suggested by the data (http://en.wikipedia.org/wiki/Testing_hypotheses_suggested_by_the_data). The problem occurs when a trend is found in data, then that same data is used to evalute if that trend is real. According to wikipedia, this is sometimes called a type III error.

We first implemented cross-validation the easiest way that came to mind, manually breaking our data into partitions using if statements and careful matrix indexing. There is also a matlab command, cvpartition (http://www.mathworks.com/help/toolbox/stats/cvpartition.html), which breaks your data up for you. Later on, we might switch to this for analyzing our results.

 Results of running 5-fold cross-validation with a few different lambda values.

lambda fold 1 fold 2 fold 3
fold 4
fold 5 average
0.1 3.5 6.5 8 4 6.5 5.7
.5 4 7.5 4 6 4.5 5.2
1 4 7 5 5 6.5 5.5
10 4 9 5.5 5.5 5 5.9
100 3.5 6 4.5 5.5 4 4.8


As you can see, our accuracy is not very good. With 20 classes, ~5% accuracy isn’t better than a classifier that always outputs the same value. Our low accuracy could be due to our small sample size. Our next step is to collect more data and see if this could improve results.

It also takes a long time to train our classifier (~8 minutes). It might be possible to reduce the size of the image files in order to decrease the runtime, and see if that makes a difference when training with more data.

Sunday, April 8, 2012

Version Control, TODO list

We created github accounts (Kyle, Oren) for version control. Neither of us is currently familiar with github, but we are using this as an opportunity to learn a new and useful tool.

The HERC repo can be found here.

Goals/TODO for the week(mostly collected from previous posts):

Create a detailed specification

Become more familiar with github
Clean up the code we have, increase documentation.
Write a README

Figure out how to use InftyMDB
possibly make toydataset2
finalize planned range of math symbols for dataset

Look into ways to increase accuracy.

Cross validation
Different lambda parameters

Run the code on a larger dataset.
Consider alternate ways to classify (SVM?)


Write code to extract characters based on bounding box to feed into classifier
Read more papers on the  character localization/extraction
Think about fixing = vs - problem

Localization/character extraction!

One of the most difficult problems we anticipated going into this project was extracting characters for the classifier. With a little bit of searching I was able to find this post on stackoverflow that had a quick, easy solution.


The general idea is:

1) Make the image matrix binary
2) Select connected regions using matlab's bwlabel function:
3) Get bounding boxes for these connected regions.

Modifying that code slightly lead to these results:


The bounding boxes for the digits is nearly perfect.


So far the biggest problem to fix with localization is disambiguating = and -. More generally, symbols with multiple non-connected parts are a challenge.I'm thinking of maybe adding a heuristic that searches vertically a distance proportional to max(height, width) for composite parts to merge bounding boxes for. Another technique entirely may be the answer though, or backing off that problem to the parser. Parsing based on position (=, {super,sub}scripts) is the new biggest challenge overall. Localization/bounding box/Character extraction TODO: write code to extract characters based on bounding box to feed into classifier read more papers on the subject fix = vs - problem

Current Classifier results


I’ve written code that takes our images and creates a data_x matrix where the rows are character samples and a data_y matrix of corresponding class identities. We fed these into code I wrote for the stanford ml-class. The code builds an one-vs-all classifier using regularized logistic regression.

Originally it reported a 80.7% true positives rating on the training set, but after Oren’s preprocessing script removed some noise true positives shot up to 90.8%!


These numbers are exciting but they don't actually mean much because we didn't do cross-validation or have a training/test set division. This was mostly to make sure the toy dataset would work with the classifier. Adding correct methodology and increasing accuracy are both high priorities now.

There are 20 classes that have 50 samples each, for a total of 1000 samples.

Below is the confusion matrix:


row/col legend:
1 +
2 (
3 )
4 =
5 f
6 -
7 /
8 ^
9 alpha
10 x
11.      0
12.      1
13.      2
14.      3
15. 4
16.      5
17.      6
18.      7
19.      8
20.     9

Classifier TODO:
Look into ways to increase accuracy.
Cross validation
Different lambda parameters
Run the code on a larger dataset.
Consider alternate ways to classify (SVM?)

Preprocessing/Dataset progress


I am splitting up the update post into 4 posts by content:

First, this one with preprocessing / dataset stuff.
Next, classifier stuff.
Then, localization/bounding box stuff.
Finally, a brief TODO for the week and notes on version control.

This is for ease of reading/accessing posts by content in the future.

We have begun to play with our toy dataset!

The first task was removing the black grid lines so our samples wouldn’t have a bunch of extraneous noise. Oren wrote a script that did a fantastic job of erasing these lines:

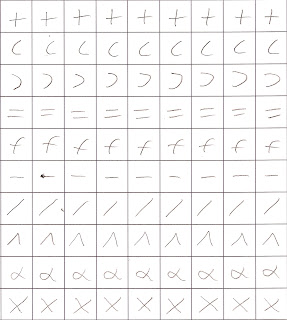
Here is an example of an original dataset image:


The result of the preprocessing script:


We would like to thank Jeanne Wang for bringing the inftyMDB dataset to our attention. We have downloaded it, and are currently trying to figure out how to use it.


The inftyMDB dataset can be found here

In our proposal we planned to use mechanical turk to generate a dataset by the end of the first week,however I feel we need a few more iterations of toy datasets and to use the
inftyMDB dataset before we generate a final dataset.

Current dataset goals include:

Figure out how to use
inftyMDB
possibly make toydataset2
finalize planned range of math symbols for dataset

Tuesday, April 3, 2012

Getting Started

Project Abstract:

While handwriting provides an efficient means to write mathematical symbols quickly, it is a poor medium for rapid exchange and editing of documents. Meanwhile, advanced typesetting systems like LaTeX and MathML have provided an environment where mathematical symbols can be typeset with precision, but at the cost of typing time and a steep learning curve. In order to facilitate the exchange, preservation and ease of editing of mathematical documents, we propose a method of offline handwritten equational recognition. Our system takes a handwritten document, for example a students calculus homework, then partitions, classifies and parses the document into LaTeX.

Current Progress:

We currently have a small toy dataset, and are attempting to get classifier code we have now to work with it. We are using this time to figure out what we think is a reasonable scope of mathematical symbols before we create a larger dataset.


Sample data set.

Soon, we should have a good idea what qualities we would like in our dataset. At that point we will use Mechanical Turk.

In addition, we are researching localization / bounding-box techniques. Once we have a dataset, the next step will be to focus on the partitioning of data.